Problem
When using a image for pointStyle in a Chart.js graph it is really apparent when the data points on the edge of the graph are cut off.
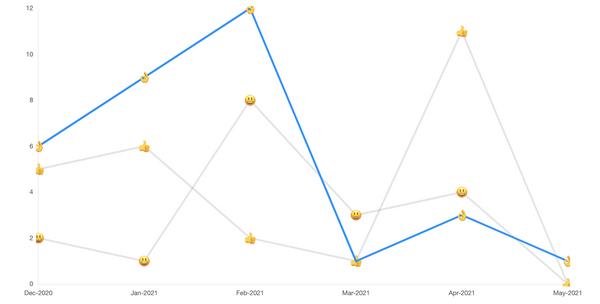
Chartjs
Solution
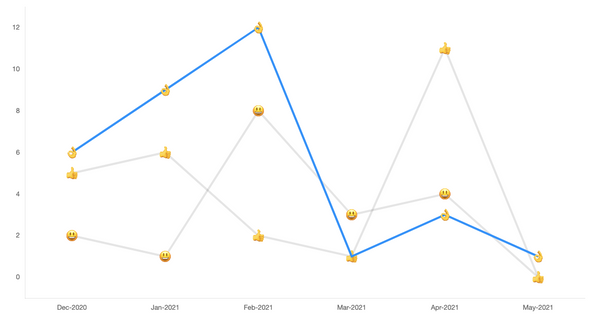
Initially I played around by changing the min/max of the tick marks, but it started to get quite hacky especially since I then had to manually remove tick marks after. Long story short, the offset option under the scales namespace adds the appropriate padding so the points on the edge do not get cut off
const config = {
    options: {
        scales: {
            x: {
                offset: true
            },
            y: {
                offset: true
            }
        }
    }
}
Chartjs