It turns out that growing a tiny human comes with many ups and downs—especially when it comes to food. After 35 weeks where I went from being nauseous to frantic flavour cravings I decided to go through my notes from the period and make a (cute?) visualization.
Ideation / sketching
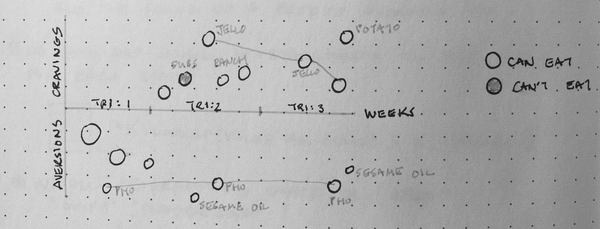
Most of my visualizations start off with a simple sketch on paper so I can get my ideas out before they vanish from my brain.
Data
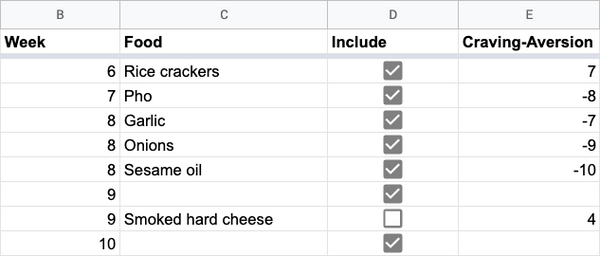
While I didn't meticulously log my pregnancy, I did take sporadic notes about my cravings and aversions. With these notes and my previous grocery orders I rated my cravings and aversions on a scale of -10 to 10, with -10 being vomit-inducing and 10 being insatiable and unrelenting cravings for weeks 6 to 35. The weeks are approximates based on my notes and grocery orders; I didn't know I was expecting until week 5ish. Originally I was going to categorize the foods between ones I could vs couldn't eat, but only one item fit this category so I chose to not include it rather than complicating the "story".
Custom point styles
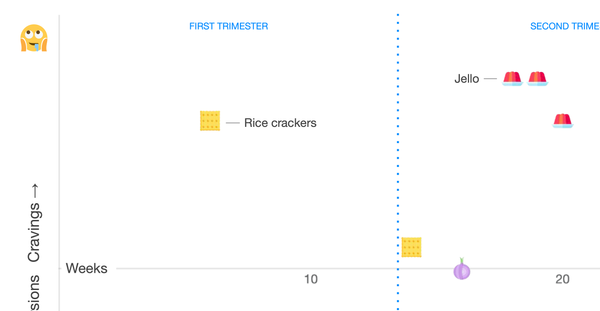
My initial idea was for a basic scatter plot with food rating on the y-axis and weeks on the x-axis, but then I thought it would be "cute" to use icons to represent the different foods as the point style. Google Sheets does not offer this capability, and making the visualization manually seemed rather tedious and a lost opportunity to learn something new.
This is where Chart.js comes in. Compared to D3.js, Chart.js looks to be more friendly to use for non-complex charts. The documentation for Chart.js is also pretty clear and thorough. After a quick skim of the Getting Started and some googling I was able to make a sample chart with .svg icons as the point style.
// snippet: how to set SVG image as the point style in a Chart.js chart
const makeIcon = (src) => {
	let icon = new Image();
  icon.src = src;
  icon.width = 24;
  icon.height = 24;
  return icon;
}

const cookies = makeIcon ('icons/cookie.svg')'

const datasets = [
	{
		label: 'cookies',
		data: [0, 2, 4, 6, 8],
		// set the point style to the cookie icon
		pointStyle: cookies
	}
]

const data = {
	labels: [1, 2, 3, 4, 5],
  datasets,
};
Dynamically fetching my data to populate the chart
I could have copied over the data from Google Sheets into a Javascript array for Chart.js but with 10 different data series (one for each food) and the possibility of adding more foods in the remaining weeks, dynamically inserting made more sense. I also wanted to keep my Javascript skills fresh. But it was frustrating; I my Javascript skills were a bit stale! Nonetheless, I wanted to output my data from Google Sheets into JSON format, and then read in the JSON for Chart.js to render the chart.
{
	"Cookies": [..., "null", 5, "null", 5, ...],
	"Garlic": [..., "null", "null", -7, ...]
}
Long story short, after looking through some old Javascript notes on using fetch() and looking up how to create a text file in Google Drive I am able to take my cravings and aversions data from Google Sheets and plunk it into a web page for Chart.js to render.
Additional touches
While the chart generated by Chart.js looks pretty good, I wanted to add some finishing touches. Saving the chart into .png format was simply right-clicking and saving. I did my finishing touches in Google Slides, although I could have used Pixelmator Pro or any other image tool. Using the Remixoji webapp I built last year I added some custom emojis to represent cravings and aversions on the y-axis.

Cropping for Instagram
Since the visualization is quite wide, I had planned to make it span 3 images on Instagram so my Google Slide dimensions are 3240px by 1080px. You can download the slide as a .png but a lot of quality is lost, so I typically download it as a PDF and convert the PDF to a .png. I cut the .png into 3 1080 x 1080 images.